Lean thinking aims to remove wastes from work processes. The seven wastes are Transportation, Inventory, Motion, Waiting, Overproduction, Overprocessing and Defects. They are often referred to by the acronym 'TIMWOOD'.
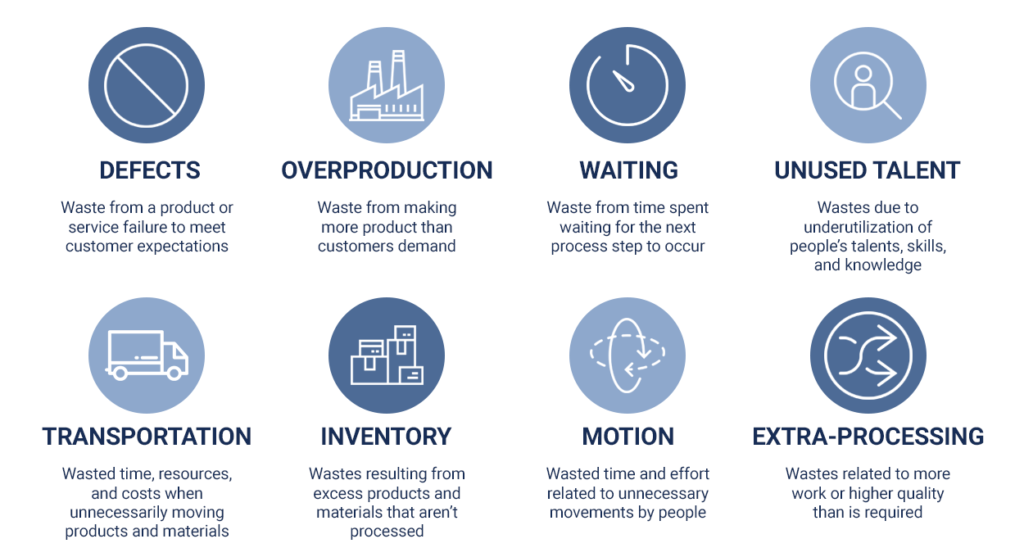
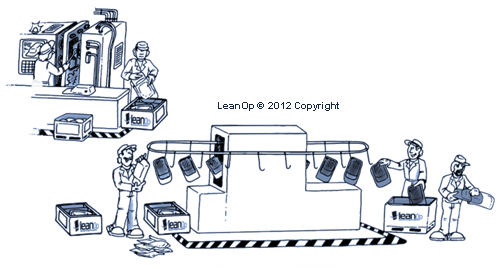
1. Transport
Waste
in transportation includes movement of people, tools, inventory,
equipment, or products further than necessary. Excessive movement of
materials can lead to product damage and defects. Additionally,
excessive movement of people and equipment can lead to unnecessary work,
greater wear and tear, and exhaustion.
In the office, workers
who collaborate with each other often should be close together. In the
factory, materials necessary for production should be easily accessible
at the production location and double or triple handling of materials
should be avoided.
Some of the countermeasures to
transportation waste includes developing a U-shape production line,
creating flow between processes, and not over-producing work in process
(WIP) items.
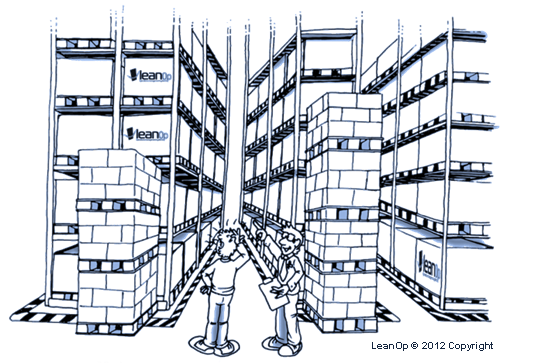
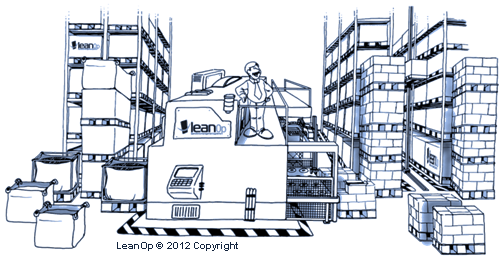
2. Inventory
Often
times it is difficult to think about excess inventory as waste. In
accounting, inventory is seen as an asset and oftentimes suppliers give
discount for bulk purchases. But having more inventory than necessary to
sustain a steady flow of work can lead to problems including: product
defects or damage materials, greater lead time in the production
process, an inefficient allocation of capital, and problems being hidden
away in the inventory. Excess inventory can be caused by
over-purchasing, overproducing work in process (WIP), or producing more
products than the customer needs. Excess inventory prevents detecting
production-related problems since defects have time to accumulate before
it is discovered. As a result, more work will be needed to correct the
defects.
In-office inventory waste could be files waiting to be
worked on, customers waiting for service, unused records in a database,
or obsolete files. Manufacturing inventory waste could include broken
machines sitting around, more finished products than demanded, extra
materials taking up work space, and finished products that cannot be
sold.
Some countermeasures for inventory include: purchasing
raw materials only when needed and in the quantity needed, reducing
buffers between production steps, and creating a queue system to prevent
overproduction.
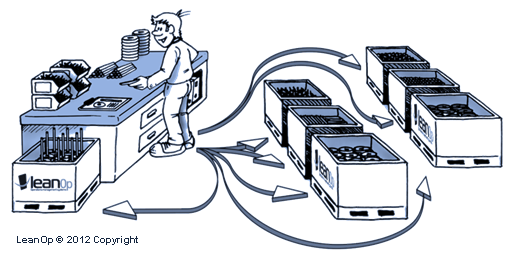
3. Motion
The
waste in motion includes any unnecessary movement of people, equipment,
or machinery. This includes walking, lifting, reaching, bending,
stretching, and moving. Tasks that require excessive motion should be
redesigned to enhance the work of personnel and increase the health and
safety levels.
In the office, wasted motion can include
walking, reaching to get materials, searching for files, sifting through
inventory to find what is needed, excess mouse clicks, and double entry
of data. Manufacturing motion waste can include repetitive movements
that do not add value to the customer, reaching for materials, walking
to get a tool or materials, and readjusting a component after it has
been installed.
Some countermeasures for motion include making
sure the workspace is well organized, placing equipment near the
production location, and putting materials at an ergonomic position to
reduce stretching and straining.
The
waste of waiting includes: 1) people waiting on material or equipment
and 2) idle equipment. Waiting time is often caused by unevenness in the
production stations and can result in excess inventory and
overproduction.
In the office, waiting waste can include
waiting for others to respond to an email, having files waiting for
review, ineffective meetings, and waiting for the computer to load a
program. In the manufacturing facility, waiting waste can include
waiting for materials to arrive, waiting for the proper instructions to
start manufacturing, and having equipment with insufficient capacity.
Some countermeasures for waiting include: designing processes to ensure
continuous flow or single piece flow, leveling out the workload by
using standardized work instructions, and developing flexible
multi-skilled workers who can quickly adjust in the work demands.
5. Overproduction
Overproduction
occurs when manufacturing a product or an element of the product before
it is being asked for or required. It may be tempting to produce as
many products as possible when there is idle worker or equipment time.
However, rather than producing products just when they are needed under
the ‘Just In Time’ philosophy, the ‘Just In Case’ way of working leads a
host of problems including preventing smooth flow of work, higher
storage costs, hiding defects inside the WIP, requiring more capital
expenditure to fund the production process, and excessive lead-time.
Additionally, over-producing a product also leads to an increase in
likelihood that the product or quantities of products produced are
beyond the customer’s requirements.
In an office environment,
overproduction could include making extra copies, creating reports no
one reads, providing more information than needed, and providing a
service before the customer is ready. Manufacturing overproduction
involves producing more products than demanded through a ‘push
production system’ or producing products in higher batch sizes than
needed.
There are three countermeasures for overproduction.
Firstly, using a ‘Takt Time’ ensures that the rate of manufacturing
between stations are even. Secondly, reducing setup times enables
manufacturing small batches or single-piece flow. Thirdly, using a pull
or ‘Kanban’ system can control the amount of WIP.
6. Over-processing
Over-processing
refers to doing more work, adding more components, or having more steps
in a product or service than what is required by the customer. In
manufacturing this could include using a higher precision equipment than
necessary, using components with capacities beyond what is required,
running more analysis than needed, over-engineering a solution,
adjusting a component after it has already been installed, and having
more functionalities in a product than needed. In the office,
over-processing can include generating more detailed reports than
needed, having unnecessary steps in the purchasing process, requiring
unnecessary signatures on a document, double entry of data, requiring
more forms than needed, and having an extra step in a workflow.
One simple way to counter over-processing is to understand the work
requirements from the standpoint of the customer. Always have a customer
in mind before starting work, produce to the level of quality and
expectation that the customer desires, and make only the quantities
needed.
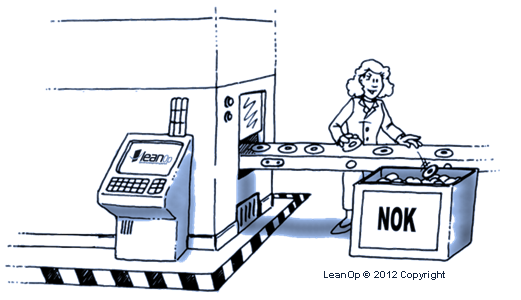
7. Defects
Defects
occurs when the product is not fit for use. This typically results in
either reworking or scrapping the product. Both results are wasteful as
they add additional costs to the operations without delivering any value
to the customer.
Here are four countermeasures for defects.
Firstly, look for the most frequent defect and focus on it. Secondly,
design a process to detect abnormalities and do not pass any defective
items along the production process. Thirdly, redesign the process so
that does not lead to defects. Lastly, use standardize work to ensure a
consistent manufacturing process that is defect free.
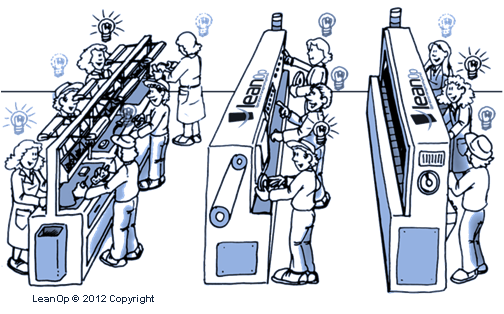
8. Skills - The 8th Waste
Even
though it was not part of the Toyota Production System (TPS), many
people are well aware of the 8th waste - the waste of human potential.
The 8th waste is also described as the waste of unused human talent and
ingenuity. This waste occurs when organizations separate the role of
management from employees. In some organizations, management’s
responsibility is planning, organizing, controlling, and innovating the
production process. The employee’s role is to simply follow orders and
execute the work as planned. By not engaging the frontline worker’s
knowledge and expertise, it is difficult to improve processes. This is
due to the fact that the people doing the work are the ones who are most
capable of identifying problems and developing solutions for them.
In the office, non-utilized talent could include insufficient training,
poor incentives, not asking for employee feedback, and placing
employees in positions below their skills and qualifications. In
manufacturing, this waste can be seen when employees are poorly trained,
employees not knowing how to effectively operate equipment, when
employees are given the wrong tool for the job, and when employees are
not challenged to come up with ideas to improve the work.
Identifying and Eliminating the 8 WastesThe
first step to reducing waste is recognizing that they exist and having
an effective process for identifying them. Value Stream Mapping (VSM) is
a Lean management method for analyzing the current state and designing a
future state. It shows the flow of information and material as they
occur. VSM is an effective tool for mapping out the processes involved,
displaying the relationship between production processes in a visual
manner, and for separating value-added and non-value-added activities.
In order to identify wastes, use the VSM and start with the end
customer in mind. Work backwards from the end customer to the start of
the production processes. Document instances of the 8 wastes in the
processes and develop a plan for eliminating or reducing them. Continue
challenging your team to find more wastes and continuously improve
your processes. Engage with the frontline workers and elicit their
ideas for improvement. As your team begins reducing efficiencies they
will gain more confidence in their problem-solving capabilities and over
time reducing waste becomes a part of their daily routine.
A lean organization understands customer value and focuses its key processes to continuously increase it. The ultimate goal is to provide perfect value to the customer through a perfect value creation process that has zero waste.
To accomplish this, lean thinking changes the focus of management from optimizing separate technologies, assets, and vertical departments to optimizing the flow of products and services through entire value streams that flow horizontally across technologies, assets, and departments to customers.
Eliminating waste along entire value streams, instead of at isolated points, creates processes that need less human effort, less space, less capital, and less time to make products and services at far less costs and with much fewer defects, compared with traditional business systems. Companies are able to respond to changing customer desires with high variety, high quality, low cost, and with very fast throughput times. Also, information management becomes much simpler and more accurate.
Lean for Production and Services
A popular misconception is that lean is suited only for manufacturing. Not true. Lean applies in every business and every process. It is not a tactic or a cost reduction program, but a way of thinking and acting for an entire organization.
Businesses in all industries and services, including healthcare and governments, are using lean principles as the way they think and do. Many organizations choose not to use the word lean, but to label what they do as their own system, such as the Toyota Production System or the Danaher Business System. Why? To drive home the point that lean is not a program or short term cost reduction program, but the way the company operates. The word transformation or lean transformation is often used to characterize a company moving from an old way of thinking to lean thinking. It requires a complete transformation on how a company conducts business. This takes a long-term perspective and perseverance.
The term "lean" was coined to describe Toyota's business during the late 1980s by a research team headed by Jim Womack, Ph.D., at MIT's International Motor Vehicle Program.
The characteristics of a lean organization and supply chain are described in Lean Thinking, by Womack and Dan Jones, founders of the Lean Enterprise Institute and the Lean Enterprise Academy (UK), respectively. While there are many very good books about lean techniques, Lean Thinking remains one of the best resources for understanding "what is lean" because it describes the thought process, the overarching key principles that must guide your actions when applying lean techniques and tools.
https://www.youtube.com/watch?v=8EXS9wR0VRc&feature=youtu.beValue Stream Mapping

JIT & KanBan