Wednesday, December 16, 2020

Six Sigma / Lean

Lean thinking aims to remove wastes from work processes. The seven wastes are Transportation, Inventory, Motion, Waiting, Overproduction, Overprocessing and Defects. They are often referred to by the acronym 'TIMWOOD'.

what is lean

1. Transport

Waste in transportation includes movement of people, tools, inventory, equipment, or products further than necessary. Excessive movement of materials can lead to product damage and defects. Additionally, excessive movement of people and equipment can lead to unnecessary work, greater wear and tear, and exhaustion.

In the office, workers who collaborate with each other often should be close together. In the factory, materials necessary for production should be easily accessible at the production location and double or triple handling of materials should be avoided.

Some of the countermeasures to transportation waste includes developing a U-shape production line, creating flow between processes, and not over-producing work in process (WIP) items.

lean waste

2. Inventory

Often times it is difficult to think about excess inventory as waste. In accounting, inventory is seen as an asset and oftentimes suppliers give discount for bulk purchases. But having more inventory than necessary to sustain a steady flow of work can lead to problems including: product defects or damage materials, greater lead time in the production process, an inefficient allocation of capital, and problems being hidden away in the inventory. Excess inventory can be caused by over-purchasing, overproducing work in process (WIP), or producing more products than the customer needs. Excess inventory prevents detecting production-related problems since defects have time to accumulate before it is discovered. As a result, more work will be needed to correct the defects.

In-office inventory waste could be files waiting to be worked on, customers waiting for service, unused records in a database, or obsolete files. Manufacturing inventory waste could include broken machines sitting around, more finished products than demanded, extra materials taking up work space, and finished products that cannot be sold.

Some countermeasures for inventory include: purchasing raw materials only when needed and in the quantity needed, reducing buffers between production steps, and creating a queue system to prevent overproduction.

inventory waste

3. Motion

The waste in motion includes any unnecessary movement of people, equipment, or machinery. This includes walking, lifting, reaching, bending, stretching, and moving. Tasks that require excessive motion should be redesigned to enhance the work of personnel and increase the health and safety levels.

In the office, wasted motion can include walking, reaching to get materials, searching for files, sifting through inventory to find what is needed, excess mouse clicks, and double entry of data. Manufacturing motion waste can include repetitive movements that do not add value to the customer, reaching for materials, walking to get a tool or materials, and readjusting a component after it has been installed.

Some countermeasures for motion include making sure the workspace is well organized, placing equipment near the production location, and putting materials at an ergonomic position to reduce stretching and straining.

motion waste

4. Waiting

The waste of waiting includes: 1) people waiting on material or equipment and 2) idle equipment. Waiting time is often caused by unevenness in the production stations and can result in excess inventory and overproduction.

In the office, waiting waste can include waiting for others to respond to an email, having files waiting for review, ineffective meetings, and waiting for the computer to load a program. In the manufacturing facility, waiting waste can include waiting for materials to arrive, waiting for the proper instructions to start manufacturing, and having equipment with insufficient capacity.

Some countermeasures for waiting include: designing processes to ensure continuous flow or single piece flow, leveling out the workload by using standardized work instructions, and developing flexible multi-skilled workers who can quickly adjust in the work demands.

waiting waste

5. Overproduction

Overproduction occurs when manufacturing a product or an element of the product before it is being asked for or required. It may be tempting to produce as many products as possible when there is idle worker or equipment time. However, rather than producing products just when they are needed under the ‘Just In Time’ philosophy, the ‘Just In Case’ way of working leads a host of problems including preventing smooth flow of work, higher storage costs, hiding defects inside the WIP, requiring more capital expenditure to fund the production process, and excessive lead-time. Additionally, over-producing a product also leads to an increase in likelihood that the product or quantities of products produced are beyond the customer’s requirements.

In an office environment, overproduction could include making extra copies, creating reports no one reads, providing more information than needed, and providing a service before the customer is ready. Manufacturing overproduction involves producing more products than demanded through a ‘push production system’ or producing products in higher batch sizes than needed.

There are three countermeasures for overproduction. Firstly, using a ‘Takt Time’ ensures that the rate of manufacturing between stations are even. Secondly, reducing setup times enables manufacturing small batches or single-piece flow. Thirdly, using a pull or ‘Kanban’ system can control the amount of WIP.

overproduction waste

6. Over-processing

Over-processing refers to doing more work, adding more components, or having more steps in a product or service than what is required by the customer. In manufacturing this could include using a higher precision equipment than necessary, using components with capacities beyond what is required, running more analysis than needed, over-engineering a solution, adjusting a component after it has already been installed, and having more functionalities in a product than needed. In the office, over-processing can include generating more detailed reports than needed, having unnecessary steps in the purchasing process, requiring unnecessary signatures on a document, double entry of data, requiring more forms than needed, and having an extra step in a workflow.

One simple way to counter over-processing is to understand the work requirements from the standpoint of the customer. Always have a customer in mind before starting work, produce to the level of quality and expectation that the customer desires, and make only the quantities needed.

overprocessing waste

7. Defects

Defects occurs when the product is not fit for use. This typically results in either reworking or scrapping the product. Both results are wasteful as they add additional costs to the operations without delivering any value to the customer.

Here are four countermeasures for defects. Firstly, look for the most frequent defect and focus on it. Secondly, design a process to detect abnormalities and do not pass any defective items along the production process. Thirdly, redesign the process so that does not lead to defects. Lastly, use standardize work to ensure a consistent manufacturing process that is defect free.

defects waste

8. Skills - The 8th Waste

Even though it was not part of the Toyota Production System (TPS), many people are well aware of the 8th waste - the waste of human potential. The 8th waste is also described as the waste of unused human talent and ingenuity. This waste occurs when organizations separate the role of management from employees. In some organizations, management’s responsibility is planning, organizing, controlling, and innovating the production process. The employee’s role is to simply follow orders and execute the work as planned. By not engaging the frontline worker’s knowledge and expertise, it is difficult to improve processes. This is due to the fact that the people doing the work are the ones who are most capable of identifying problems and developing solutions for them.

In the office, non-utilized talent could include insufficient training, poor incentives, not asking for employee feedback, and placing employees in positions below their skills and qualifications. In manufacturing, this waste can be seen when employees are poorly trained, employees not knowing how to effectively operate equipment, when employees are given the wrong tool for the job, and when employees are not challenged to come up with ideas to improve the work.

skills waste

Identifying and Eliminating the 8 WastesThe first step to reducing waste is recognizing that they exist and having an effective process for identifying them. Value Stream Mapping (VSM) is a Lean management method for analyzing the current state and designing a future state. It shows the flow of information and material as they occur. VSM is an effective tool for mapping out the processes involved, displaying the relationship between production processes in a visual manner, and for separating value-added and non-value-added activities.

In order to identify wastes, use the VSM and start with the end customer in mind. Work backwards from the end customer to the start of the production processes. Document instances of the 8 wastes in the processes and develop a plan for eliminating or reducing them. Continue challenging your team to find more wastes and continuously improve your processes. Engage with the frontline workers and elicit their ideas for improvement. As your team begins reducing efficiencies they will gain more confidence in their problem-solving capabilities and over time reducing waste becomes a part of their daily routine. 


The core idea of LEAN is to maximize customer value while minimizing waste. Simply, lean means creating more value for customers with fewer resources. 

A lean organization understands customer value and focuses its key processes to continuously increase it. The ultimate goal is to provide perfect value to the customer through a perfect value creation process that has zero waste.

To accomplish this, lean thinking changes the focus of management from optimizing separate technologies, assets, and vertical departments to optimizing the flow of products and services through entire value streams that flow horizontally across technologies, assets, and departments to customers.

Eliminating waste along entire value streams, instead of at isolated points, creates processes that need less human effort, less space, less capital, and less time to make products and services at far less costs and with much fewer defects, compared with traditional business systems. Companies are able to respond to changing customer desires with high variety, high quality, low cost, and with very fast throughput times. Also, information management becomes much simpler and more accurate.

Lean for Production and Services

A popular misconception is that lean is suited only for manufacturing. Not true. Lean applies in every business and every process. It is not a tactic or a cost reduction program, but a way of thinking and acting for an entire organization.

Businesses in all industries and services, including healthcare and governments, are using lean principles as the way they think and do. Many organizations choose not to use the word lean, but to label what they do as their own system, such as the Toyota Production System or the Danaher Business System. Why? To drive home the point that lean is not a program or short term cost reduction program, but the way the company operates. The word transformation or lean transformation is often used to characterize a company moving from an old way of thinking to lean thinking. It requires a complete transformation on how a company conducts business. This takes a long-term perspective and perseverance.

The term "lean" was coined to describe Toyota's business during the late 1980s by a research team headed by Jim Womack, Ph.D., at MIT's International Motor Vehicle Program.

The characteristics of a lean organization and supply chain are described in Lean Thinking, by Womack and Dan Jones, founders of the Lean Enterprise Institute and the Lean Enterprise Academy (UK), respectively. While there are many very good books about lean techniques, Lean Thinking remains one of the best resources for understanding "what is lean" because it describes the thought process, the overarching key principles that must guide your actions when applying lean techniques and tools.

https://www.youtube.com/watch?v=8EXS9wR0VRc&feature=youtu.be

Value Stream Mapping
Value-stream mapping, also known as "material- and information-flow mapping", is a lean-management method for analyzing the current state and designing a future state for the series of events that take a product or service from the beginning of the specific process until it reaches the customer.
 
Value-stream mapping - Wikipedia 

JIT & KanBan

 
Under the lean manufacturing system, seven wastes are identified: overproduction, inventory, motion, defects, over-processing, waiting, and transport.
 
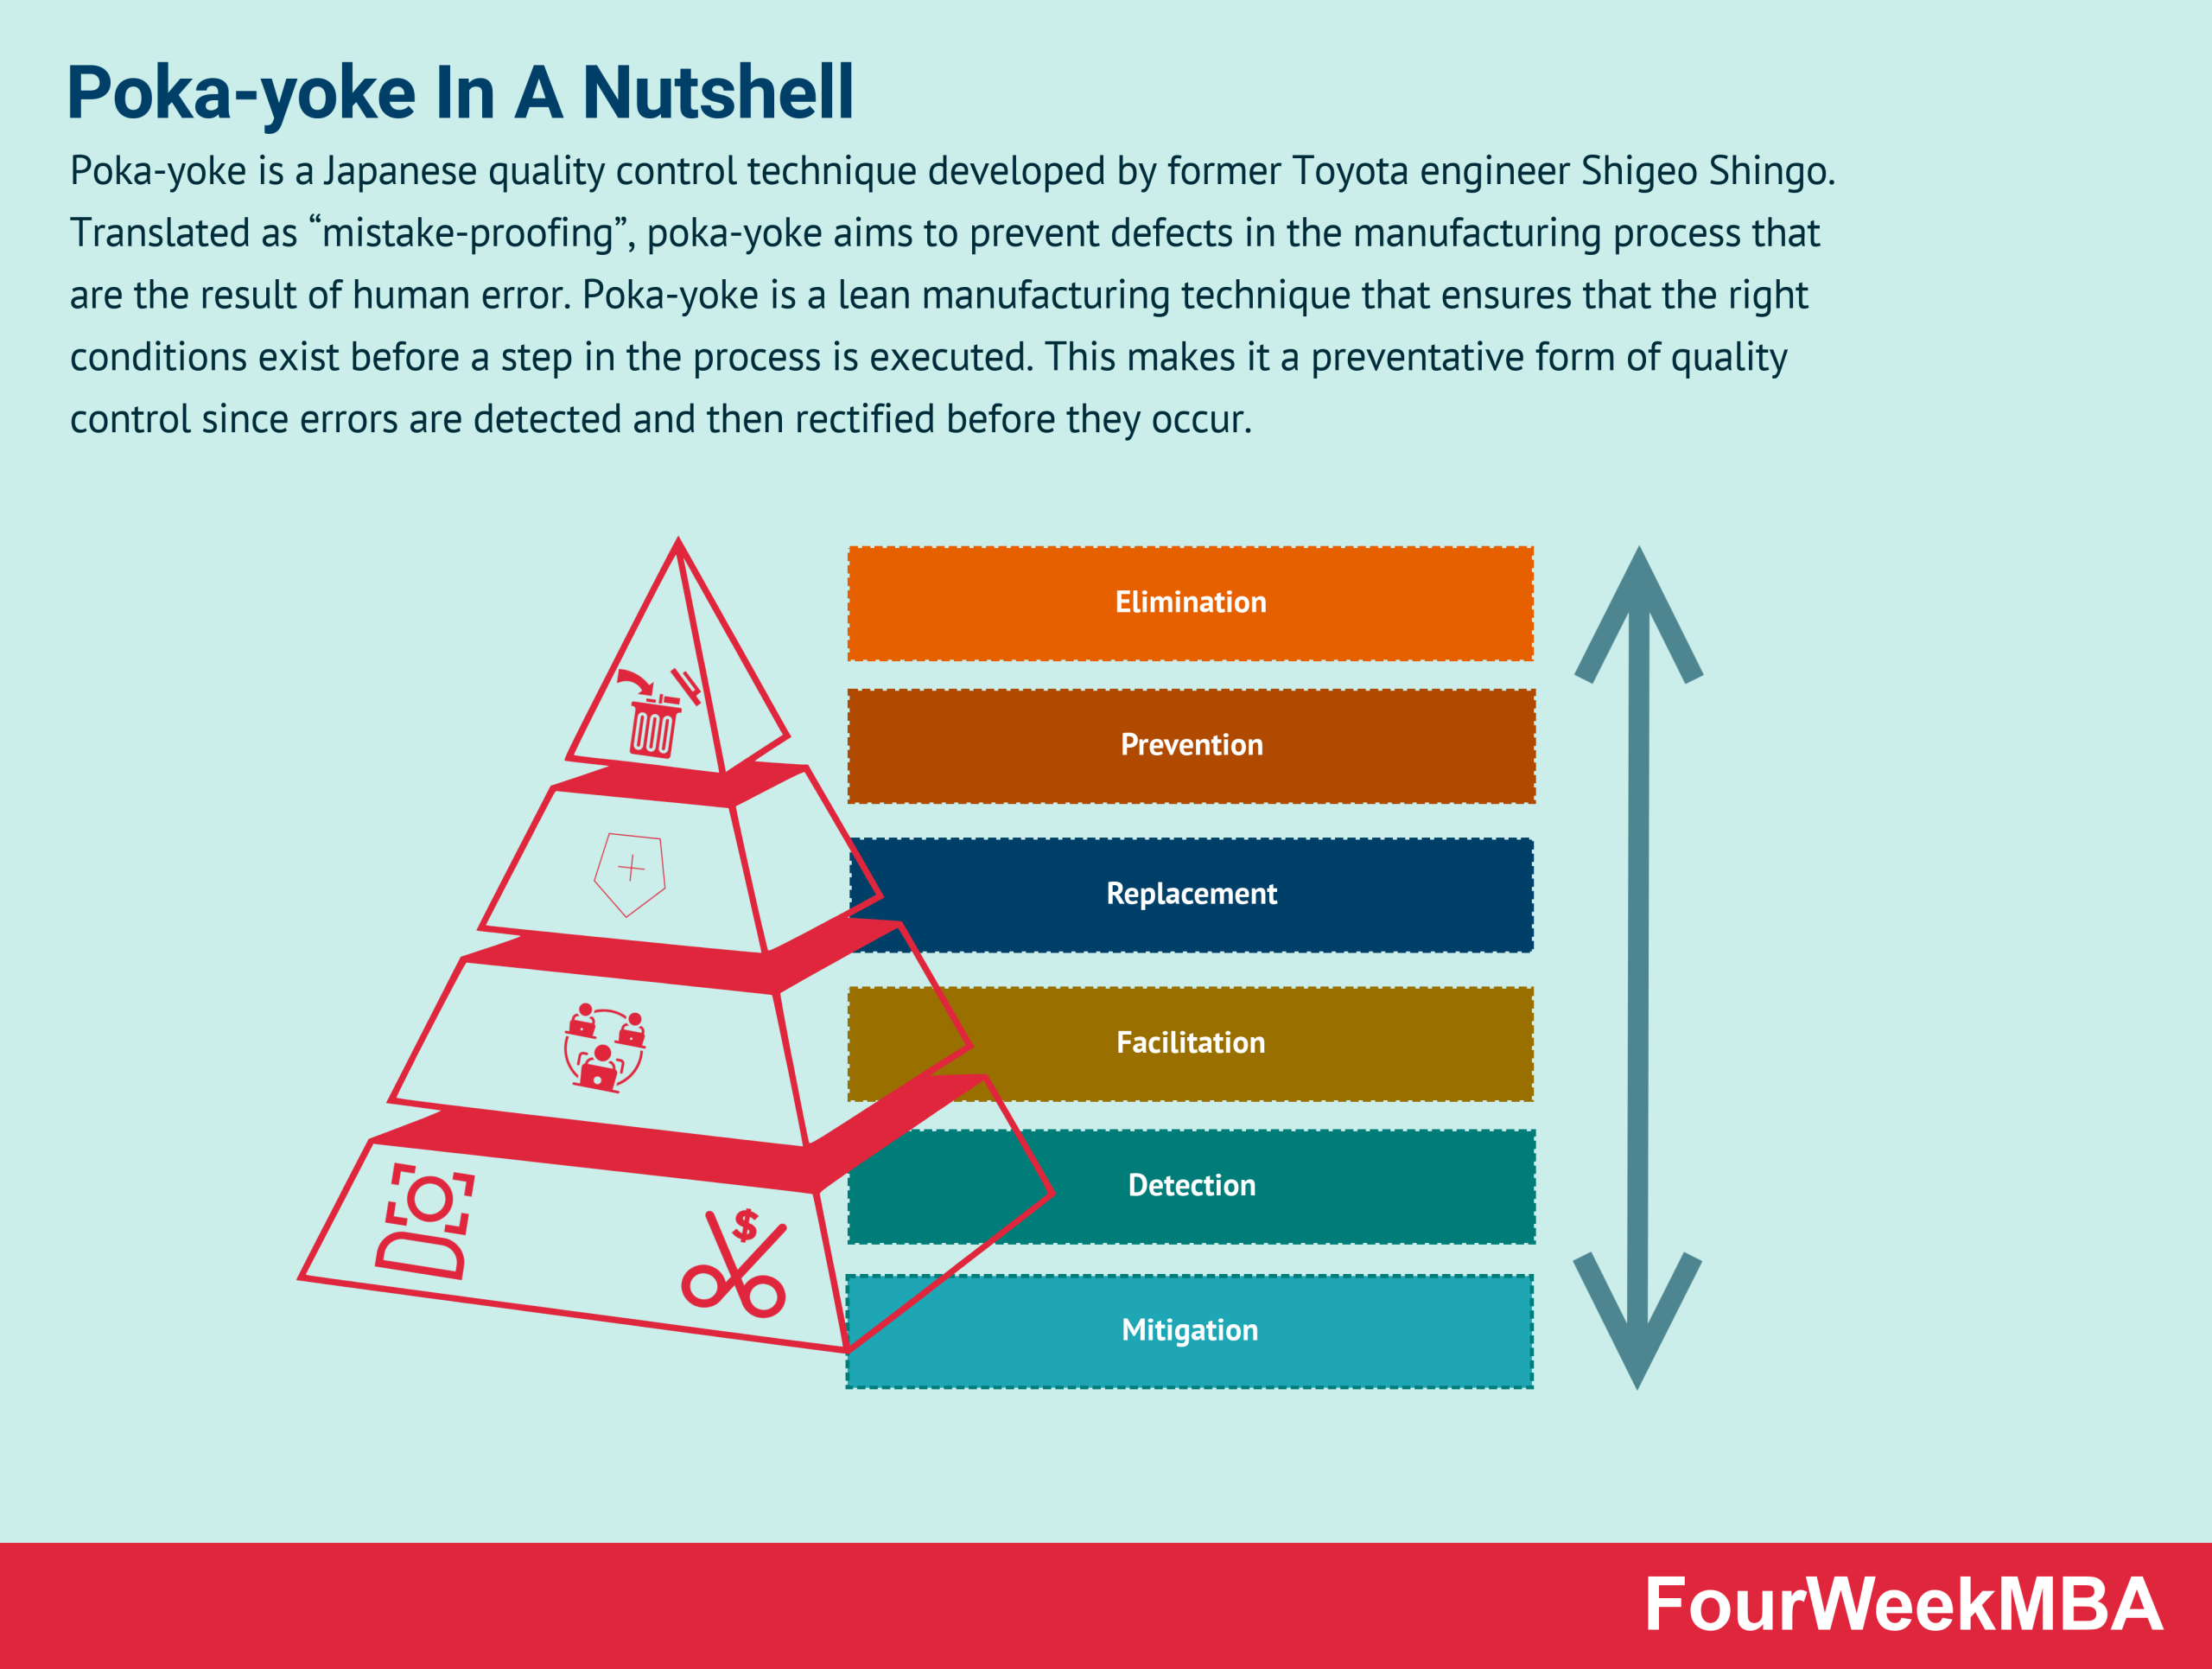
Poka-yoke is a Japanese term that means "mistake-proofing" or "inadvertent error prevention". A poka-yoke is any mechanism in any process that helps an equipment operator avoid mistakes. Its purpose is to eliminate product defects by preventing, correcting, or drawing attention to human errors as they occur.
 
Poka Yoke - ScrumandMe 
What Is Poka-yoke And Why It Matters In Business - FourWeekMBA  
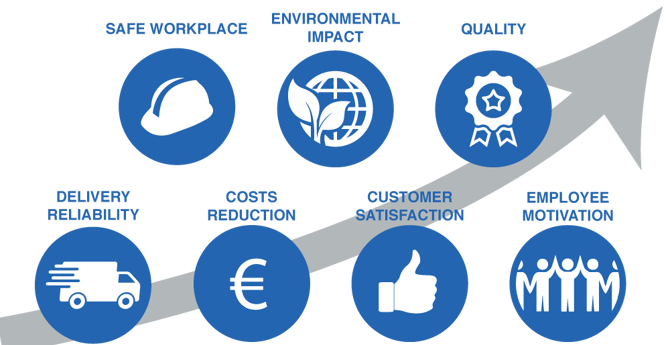
10 Benefits of Lean - Blog | Planview 
What are the benefits of lean 

Tuesday, December 15, 2020

Sigma Six III

Ideally, a Lean Six Sigma team should be between three and five or seven members, as an average. When considering an energetic and skilled leader, they should be able to properly guide the team throughout the entire process and achieve the desired results.

The five stages of team development in a graph: forming, storming, norming, performing, and adjourning.

Forming stage

The forming stage involves a period of orientation and getting acquainted. Uncertainty is high during this stage, and people are looking for leadership and authority. A member who asserts authority or is knowledgeable may be looked to take control. Team members are asking such questions as “What does the team offer me?” “What is expected of me?” “Will I fit in?” Most interactions are social as members get to know each other.

Storming stage

The storming stage is the most difficult and critical stage to pass through. It is a period marked by conflict and competition as individual personalities emerge. Team performance may actually decrease in this stage because energy is put into unproductive activities. Members may disagree on team goals, and subgroups and cliques may form around strong personalities or areas of agreement. To get through this stage, members must work to overcome obstacles, to accept individual differences, and to work through conflicting ideas on team tasks and goals. Teams can get bogged down in this stage. Failure to address conflicts may result in long-term problems.

Norming stage

If teams get through the storming stage, conflict is resolved and some degree of unity emerges. In the norming stage, consensus develops around who the leader or leaders are, and individual member’s roles. Interpersonal differences begin to be resolved, and a sense of cohesion and unity emerges. Team performance increases during this stage as members learn to cooperate and begin to focus on team goals. However, the harmony is precarious, and if disagreements re-emerge the team can slide back into storming.

Performing stage

In the performing stage, consensus and cooperation have been well-established and the team is mature, organized, and well-functioning. There is a clear and stable structure, and members are committed to the team’s mission. Problems and conflicts still emerge, but they are dealt with constructively. (We will discuss the role of conflict and conflict resolution in the next section). The team is focused on problem solving and meeting team goals.

Adjourning stage

In the adjourning stage, most of the team’s goals have been accomplished. The emphasis is on wrapping up final tasks and documenting the effort and results. As the work load is diminished, individual members may be reassigned to other teams, and the team disbands. There may be regret as the team ends, so a ceremonial acknowledgement of the work and success of the team can be helpful. If the team is a standing committee with ongoing responsibility, members may be replaced by new people and the team can go back to a forming or storming stage and repeat the development process.


Friday, December 11, 2020

Six Sigma II


Basic Tools for Quality « Dive into Risk & Project Management 

Scatter Plot and Line of Best Fit (examples, videos, worksheets, solutions,  activities)

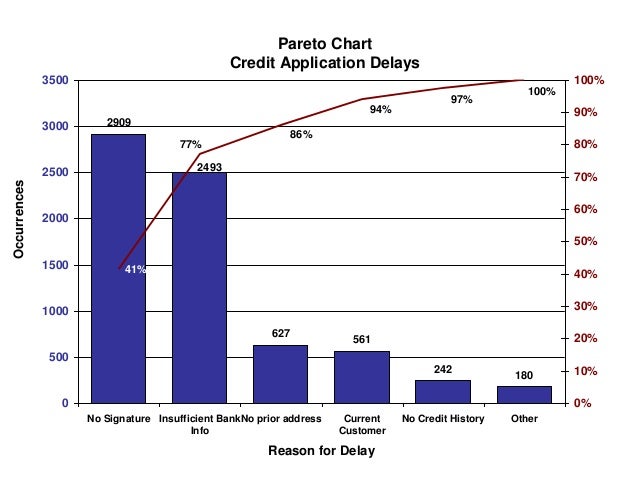
A Pareto diagram is a simple bar chart that ranks related measures in decreasing order of occurrence. The principle was developed by Vilfredo Pareto, an Italian economist and sociologist who conducted a study in Europe in the early 1900s on wealth and poverty.

The 80-20 rule maintains that 80% of outcomes (outputs) come from 20% of causes (inputs). In the 80-20 rule, you prioritize the 20% of factors that will produce the best results. A principle of the 80-20 rule is to identify an entity's best assets and use them efficiently to create maximum value.

Pareto Chart Credit Application Delays 

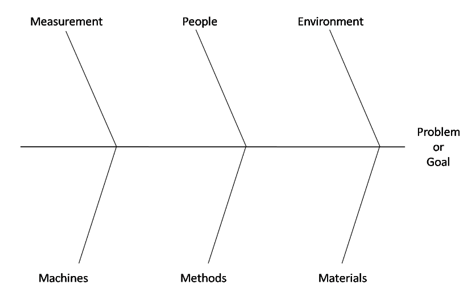
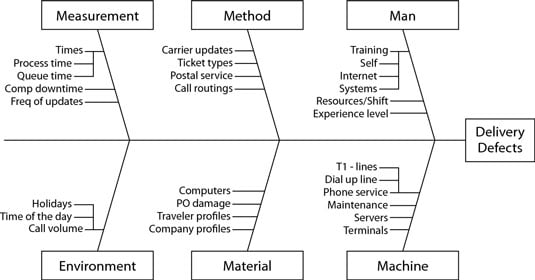
A cause-effect diagram is a visual tool used to logically organize possible causes for a specific problem or effect by graphically displaying them in increasing detail, suggesting causal relationships among theories. A popular type is also referred to as a fishbone or Ishikawa diagram. It was developed in the 1960s and explores all possible causes of a problem. One of the most basic yet powerful brainstorming tools for capturing all the potential factors in your system is a fishbone diagram, named because of its bony, fish-like shape. Sometimes a fishbone diagram is called an Ishikawa diagram, after Kaoru Ishikawa, who first suggested its use.

What is a Cause and Effect (Fishbone) Diagram? 

image0.jpg

Detailed Process Map Template | Lucidchart

A quality control checklist is basically a written guide for your products' contents, packaging, color, barcodes, appearance, possible defects, functions and special requirements. It's also sometimes called an “inspection criteria sheet” or inspection checklist.

 
scatter diagram (Also known as scatter plotscatter graph, and correlation chart) is a tool for analyzing relationships between two variables for determining how closely the two variables are related. One variable is plotted on the horizontal axis and the other is plotted on the vertical axis.

Histogram: a graphical display of data using bars of different heights. It is similar to a Bar Chart, but a histogram groups numbers into ranges . The height of each bar shows how many fall into each range.

LEAN / SIX SIGMA MEASURES

Part of the Six Sigma method is to calculate the number of defects that the process delivers. There are various metrics used to evaluate defects: Defects per Unit (DPU), Defects per Opportunity (DPO) and Defects-per-Million-Opportunities (DPMO).

Defects per Unit (DPU)

The average number of defects per unit. The ratio of defects to unit is the universal measure of quality.

Given:

D: number of Defects

U: number of Units

Formul

Defects Per Unit


Defects-Per- Million-Opportunities, which is abbreviated as DPMO. It is also called as NPMO or Nonconformities per Million Opportunities. It is defined as the ratio of the number of defects in a sample to the total number of defect opportunities multiplied by 1 million. DPMO is a long-term measure of process performance. It is a measure of the error rate of a process. The metric tells you how good your process is towards committing mistakes. It requires you to think reversely. Why is it necessary to calculate the DPMO of a process? It gives your business an accurate picture of the efficiency of your process. Depending on the Defects-per-Million-Opportunities, your company can decide whether it is necessary to launch a Six Sigma project that will improve the process and reduce the number of opportunities for defects per million products. If the DPMO is too high, you run the risk of negatively affecting customer satisfaction which in turn will reflect negatively on your business. Six Sigma business improvement projects focus on reducing errors and increasing customer satisfaction and thereby nurturing a healthy business.

Defects per Million Opportunities (DPMO) – a ratio of the number of defects (flaws) in 1 million opportunities when an item can contain more than one defect. To calculate DPMO, you need to know the total number of defect opportunities.


Defect Generation and Detection

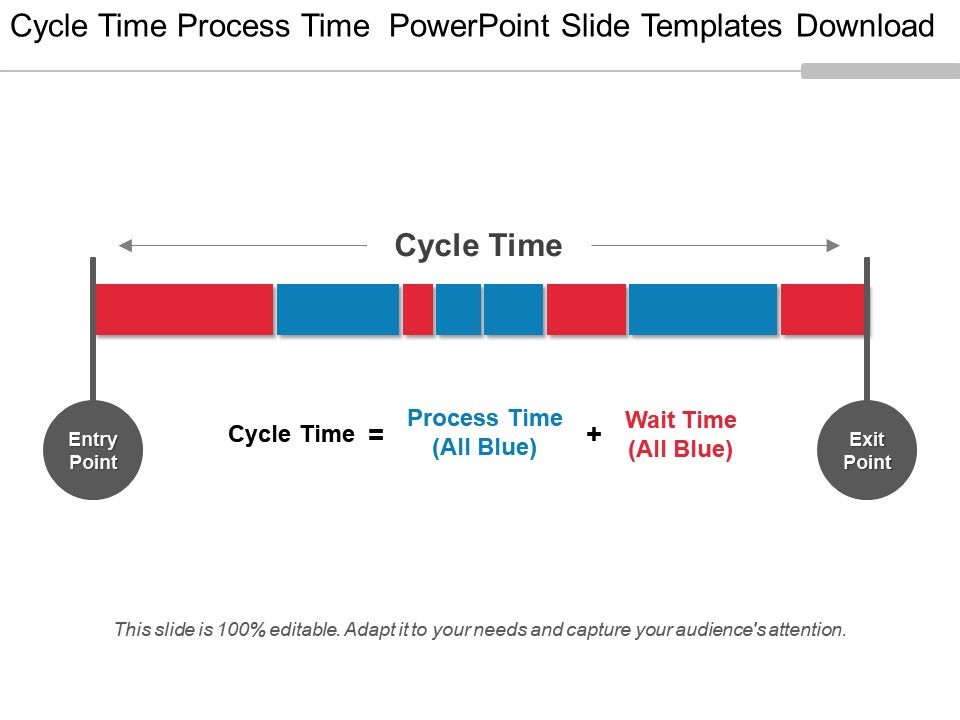
Cycle Time Process Time Powerpoint Slide Templates Download | PowerPoint  Presentation Pictures | PPT Slide Template | PPT Examples Professional

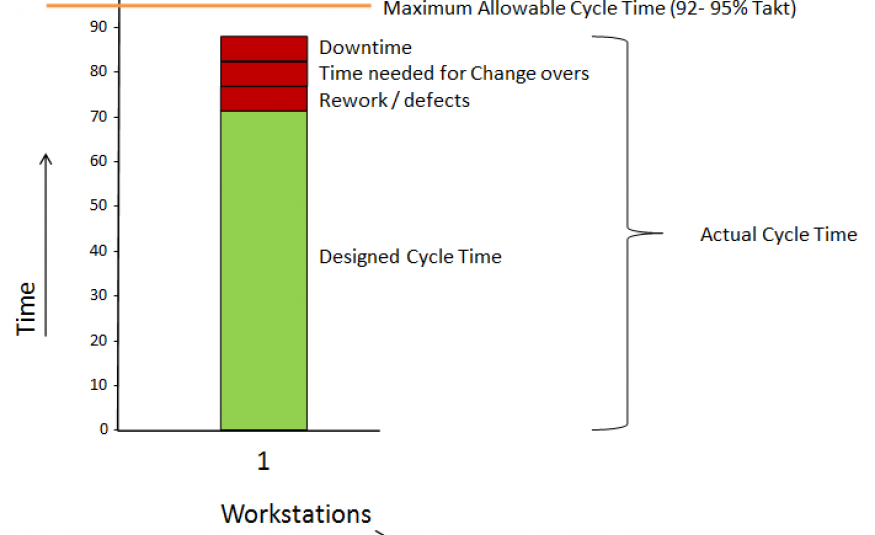
Takt-, Cycle-, Process-, and Lead time | MudaMasters

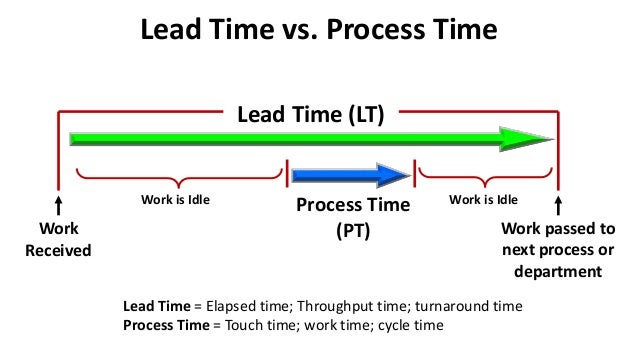
Lead Time vs. Process Time

What is Rolled Throughput Yield? - Six Sigma Ninja

Parts per Million Defective (PPM) – the number of defective units in one million units. (PPM is typically used when the number of defective products produced is small so that a more accurate measure of the defective rate can be obtained than with the percent defective.)

For example, a sample of 50 cell phones finds that 3 of them are defective. The PPM defective is then:

Rolled Throughput Yield (RTY) (also known as the First Pass Yield) – the probability (or percentage of time) that a manufacturing or service process will complete all required steps without any failures. Reliability principles are the basis for calculating the rolled throughput yield. The reliability formula for a system in series with n process steps is:

Rs = (R1) (R2) (R3) (R4) … (Rn)

Since the reliability of a process step is the yield of that process step when quality is the performance metric, this formula then becomes:

RTY= (Y1) (Y2) (Y3) (Y4) … (Yn) where Y is the yield (proportion good) for each step

For example, a four-step process has a yield of 0.98 in step 1, 0.95 in step 2, 0.90 in step 3, and 0.80 in step 4.

RTY = (0.98)(0.95)(0.90)(0.80) = 0.67032

This means that only 67.032% of the units completed on this process will make it through all four steps without needing any rework or repair.

Cost of Quality Graphical Representation Many of the COQ costs are... |  Download Scientific Diagram

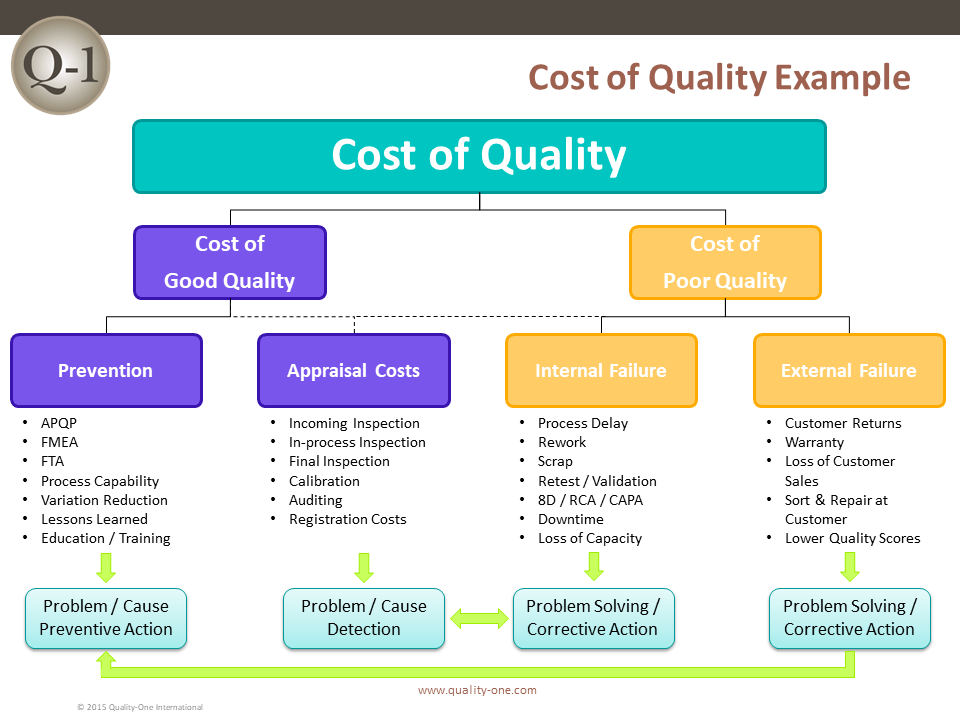
COQ | Cost of Quality | Quality-One

COPQ as used in companies ~ Cost Of Poor Quality

Companies prefer categorizing COPQ in four different categories and until date, this is the best way how COPQ could be broken down

  • Internal Failure Cost
  • External Failure Cost
  • Prevention Cost
  • Appraisal Cost

Internal Failure Cost

These costs are due to deficiencies discovered before delivery of the product, with the product not being able to meet stated and perceived needs of the customer. These costs also include process inefficiencies and process losses (See rework) even if the customer needs are met.

  • Failure to meet customer needs --- Examples are Downgrading, scrap and rework
  • Inefficient processes --- Unplanned downtime, variability of product characteristics, Difference from benchmarked products

External Failure Cost

These costs are associated with deficiencies found after product is delivered to the customer. This cost will also factor in costs due to missed sales. How? For example, you shipped 100 pens to the customer and the customer reports 10 pens defective. Chances are --- He wouldn’t pay for these 10 pens. Assume price per pen is $5. Means $50 lost due missed sales and this is nothing but an external failure cost for the company!

  • Failure to meet customer needs --- Warranty
  • Cost due lost sales --- Customer Defectives

Appraisal Cost

These are costs associated/incurred to meet the degree of conformance or determine the degree of conformance to customer requirements. You normally associate appraisal costs with inspections, audits, and evaluation of stocks.

In collecting appraisal costs, what is decisive is the kind of work done and not the department name (the work may be done by chemists in the laboratory, by sorters in Operations, by testers in Inspection, or by an external firm engaged for the purpose of testing). Also note that industries use a variety of terms for “appraisal,” e.g., checking, balancing, reconciliation, review.

Prevention Cost

Prevention costs are incurred to keep the Appraisal and Failure Costs to a bare minimum. Goes to show that appraisal and failure costs are often treated as direct indicators of how inefficient the process could be, in terms of passing defects on! Obviously no business would like to pass defects to the customer and that’s why Prevention costs kick in.

The compilation of prevention costs is initially important because it highlights the small investment made in prevention activities and suggests the potential for an increase in prevention costs with the aim of reducing failure costs.

Experience also suggests, however, that continuing measurement of prevention costs can usually be excluded in order to (1) focus on the major opportunity, i.e., failure costs, and (2) avoid the time spent discussing what should be counted as prevention costs.

This part of the section focuses on the question “How much is it costing our organization by not doing a good job on quality?” Thus we will use the term “cost of poor quality.” Most (but not all) of the total of the four categories is the cost of poor quality (clearly, prevention costs are not a cost of poor quality.) Strictly defined, the cost of poor quality is the sum of internal and external failure costs categories. But this assumes that those elements of appraisal costs—e.g., 100 percent sorting inspection or review—necessitated by inadequate processes are classified under internal failures. This emphasis on the cost of poor quality is related to a later focus in the section, i.e., quality improvement, rather than just quality cost measurement.

Wednesday, December 9, 2020

Six Sigma I


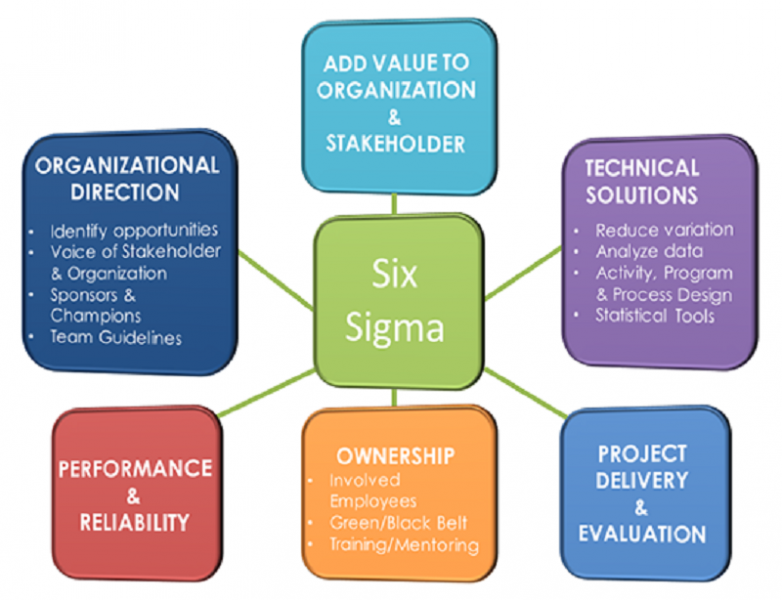
Six Sigma is a strategic process improvement approach. Is very focused and follows a five step model:

DMAIC (an acronym for Define, Measure, Analyze, Improve and Control) (pronounced dÉ™-MAY-ick) refers to a data-driven improvement cycle used for improving, optimizing and stabilizing business processes and designs. The DMAIC improvement cycle is the core tool used to drive Six Sigma projects.


The term defect rate designates the portion of defective elements in relation to all items produced. The rate is deduced by dividing the number of defective elements by the number of non-defective elements. This number is a measure of quality of the production.

Six Sigma is a quality management methodology used to help businesses improve current processes, products or services by discovering and eliminating defects. The goal is to streamline quality control in manufacturing or business processes so there is little to no variance throughout.

Six Sigma is a relatively new concept as compared to Total Quality Management (TQM). However, when it was conceptualized, it was not intended to be a replacement for TQM. Both Six Sigma and TQM have many similarities and are compatible in varied business environments, including manufacturing and service industries. While TQM has helped many companies in improving the quality of manufactured goods or services rendered, Six Sigma has the potential of delivering even sharper results.

Total Quality Management

Total Quality Management is often associated with the development, deployment, and maintenance of organizational systems that are required for various business processes. It is based on a strategic approach that focuses on maintaining existing quality standards as well as making incremental quality improvements. It can also be described as a cultural initiative as the focus is on establishing a culture of collaboration among various functional departments within an organization for improving overall quality.

Comparison To Six Sigma

In comparison, Six Sigma is more than just a process improvement program as it is based on concepts that focus on continuous quality improvements for achieving near perfection by restricting the number of possible defects to less than 3.4 defects per million. It is complementary to Statistical Process Control (SPC), which uses statistical methods for monitoring and controlling business processes. Although both SPC and TQM help in improving quality, they often reach a stage after which no further quality improvements can be made. Six Sigma, on the other hand, is different as it focuses on taking quality improvement processes to the next level. The basic difference between Six Sigma and TQM is the approach. While TQM views quality as conformance to internal requirements, Six Sigma focuses on improving quality by reducing the number of defects. The end result may be the same in both the concepts (i.e. producing better quality products). Six Sigma helps organizations in reducing operational costs by focusing on defect reduction, cycle time reduction, and cost savings. It is different from conventional cost cutting measures that may reduce value and quality. It focuses on identifying and eliminating costs that provide no value to customers such as costs incurred due to waste. TQM initiatives focus on improving individual operations within unrelated business processes whereas Six Sigma programs focus on improving all the operations within a single business process. Six Sigma projects require the skills of professionals that are certified as ‘black belts’ whereas TQM initiatives are usually a part-time activity that can be managed by non-dedicated managers.

Applications Where Six Sigma Is Better

Six Sigma initiatives are based on a preplanned project charter that outlines the scale of a project, financial targets, anticipated benefits and milestones. In comparison, organizations that have implemented TQM, work without fully knowing what the financial gains might be. Six Sigma is based on DMAIC (Define-Measure-Analyze-Improve-Control) that helps in making precise measurements, identifying exact problems, and providing solutions that can be measured.

Six sigma is also different from TQM in that it is fact based and data driven, result oriented, providing quantifiable and measurable bottom-line results, linked to strategy and related to customer requirements. It is applicable to all common business processes such as administration, sales, marketing and R & D. Although many tools and techniques used in Six Sigma may appear similar to TQM, they are often distinct as in Six Sigma, the focus is on the strategic and systematic application of the tools on targeted projects at the appropriate time. It is predicted that Six Sigma will outlast TQM as it has the potential of achieving more than TQM.

Total Quality tends to focus on culture change, empowering workers and teams and much of the improvement takes place within the departments or functions. Six Sigma focuses on high level cross-functional processes, with involvement from upper management and relies on experts to implement. Total Quality generally uses simple tools for process improvement, but these simple tools can be very powerful. You do not need complex statistical methods for everything. It is important to use the approach that fits the situation. Six Sigma uses a five step model called DMAIC, to shape improvement projects and focuses on outcomes in terms of benefits for the company. Six Sigma focuses on reducing variation, measuring defects and improving quality of products, processes and services.

Deming's 14-Point Philosophy : A Recipe for Total Quality


We know now that quality needs to be built into every level of a company, and become part of everything the organization does. From answering the phone to assembling products and serving the end customer, quality is key to organizational success. Now, quality is often thought to start and end with the customer, and all points leading to and from the customer must aim for high-quality service and interaction. So the business world developed a new appreciation for the effect of quality on production and price. Although Deming didn't create the name Total Quality Management, he's credited with starting the movement. He didn't receive much recognition for his work until 1982, when he wrote the book now titled "Out of the Crisis." This book summarized his famous 14-point management philosophy. There's much to learn from these 14 points. Study after study of highly successful companies shows that following the philosophy leads to significant improvements. That's why these 14 points have become a standard reference for quality transformation.

The 14 Points

Create a constant purpose toward improvement.

Plan for quality in the long term. Resist reacting with short-term solutions. Don't just do the same things better – find better things to do. Predict and prepare for future challenges, and always have the goal of getting better.

Adopt the new philosophy.

Embrace quality throughout the organization. Put your customers' needs first, rather than react to competitive pressure – and design products and services to meet those needs. Be prepared for a major change in the way business is done. It's about leading, not simply managing. Create your quality vision, and implement it.

Stop depending on inspections.

Inspections are costly and unreliable – and they don't improve quality, they merely find a lack of quality. Build quality into the process from start to finish. Don't just find what you did wrong – eliminate the "wrongs" altogether. Use statistical control methods – not physical inspections alone – to prove that the process is working.

Use a single supplier for any one item.

Quality relies on consistency – the less variation you have in the input, the less variation you'll have in the output. Look at suppliers as your partners in quality. Encourage them to spend time improving their own quality – they shouldn't compete for your business based on price alone. Analyze the total cost to you, not just the initial cost of the product. Use quality statistics to ensure that suppliers meet your quality standards.

Improve constantly and forever.

Continuously improve your systems and processes. Deming promoted the Plan-Do-Check-Act  approach to process analysis and improvement. Emphasize training and education so everyone can do their jobs better. Use kaizen  as a model to reduce waste and to improve productivity, effectiveness, and safety.

Use training on the job.

Train for consistency to help reduce variation. Build a foundation of common knowledge. Allow workers to understand their roles in the "big picture." Encourage staff to learn from one another, and provide a culture and environment for effective teamwork.

Implement leadership.

Expect your supervisors and managers to understand their workers and the processes they use. Don't simply supervise – provide support and resources so that each staff member can do his or her best. Be a coach instead of a policeman. Figure out what each person actually needs to do his or her best. Emphasize the importance of participative management and transformational leadership. Find ways to reach full potential, and don't just focus on meeting targets and quotas.

Eliminate fear.

Allow people to perform at their best by ensuring that they're not afraid to express ideas or concerns. Let everyone know that the goal is to achieve high quality by doing more things right – and that you're not interested in blaming people when mistakes happen. Make workers feel valued, and encourage them to look for better ways to do things. Ensure that your leaders are approachable and that they work with teams to act in the company's best interests. Use open and honest communication to remove fear from the organization.

Break down barriers between departments.

Build the "internal customer" concept – recognize that each department or function serves other departments that use their output. Build a shared vision. Use cross-functional teamwork to build understanding and reduce adversarial relationships. Focus on collaboration and consensus instead of compromise.

Get rid of unclear slogans.

Let people know exactly what you want – don't make them guess. "Excellence in service" is short and memorable, but what does it mean? How is it achieved? The message is clearer in a slogan like "You can do better if you try." Don't let words and nice-sounding phrases replace effective leadership. Outline your expectations, and then praise people face-to-face for doing good work.

Eliminate management by objectives.

Look at how the process is carried out, not just numerical targets. Deming said that production targets encourage high output and low quality. Provide support and resources so that production levels and quality are high and achievable. Measure the process rather than the people behind the process.

(There are situations in which approaches like Management By Objectives  are appropriate, for example, in motivating sales-people. As Deming points out, however, there are many situations where a focus on objectives can lead people to cut corners with quality. You'll need to decide for yourself whether or not to use these approaches. If you do, make sure that you think through the behaviors that your objectives will motivate.)

Remove barriers to pride of workmanship.

Allow everyone to take pride in their work without being rated or compared. Treat workers the same, and don't make them compete with other workers for monetary or other rewards. Over time, the quality system will naturally raise the level of everyone's work to an equally high level.

Implement education and self-improvement.

Improve the current skills of workers. Encourage people to learn new skills to prepare for future changes and challenges. Build skills to make your workforce more adaptable to change, and better able to find and achieve improvements.

Make "transformation" everyone's job.

Improve your overall organization by having each person take a step toward quality. Analyze each small step, and understand how it fits into the larger picture. Use effective change management principles to introduce the new philosophy and ideas in Deming's 14 points.

(From Deming, W. Edwards, Out of the Crisis, 14 Points, pages 23-24, © 2000 Massachusetts Institute of Technology, by permission of The MIT Press.)

Juran developed the "Juran's trilogy," an approach to cross-functional management that is composed of three managerial processes: quality planning, quality control and quality improvement. The underlying concept is that managing for quality consists of three universal processes: Quality Planning (Quality by Design) Quality Control (Process Control & Regulatory) Quality Improvement (Lean Six Sigma).

Six Sigma Belt Level Rankings

Professionals who earn Six Sigma certification become key stakeholders in improving the quality of operations within their organizations. They strive to eliminate variation in manufacturing and business operations by implementing standard processes and establishing metrics that minimize the potential for defects.

Six Sigma Belt Levels
Many of today’s leading organizations synthesize Six Sigma standardization practices with Lean manufacturing methods that cut waste to make their organizations as efficient as possible. Some of the companies that have successfully put Lean Six Sigma (LSS) principles into action include 3M, Xerox, and BAE Systems. For businesses to achieve optimal results with these initiatives, experts trained in the applicable tools and techniques must guide enterprise-wide changes.

But what do Six Sigma belt levels mean? These certifications indicate the roles that individuals are qualified to play in completing projects and promoting quality management practices. An online lean six sigma certificate program equips professionals to be active participants in optimizing their company culture and avoiding downtime.

White Belt
Professionals are considered Six Sigma White Belts if they have not undergone a formal certification program or extended training. A single session with an overview of relevant methods and vocabulary for LSS shows workers at all levels of an organization how they contribute to efficient, reliable outcomes. With this basic grounding, White Belts participate in projects and problem-solving tasks related to quality management and waste reduction.

Yellow Belt
A Yellow Belt designation indicates an exposure to Six Sigma concepts that goes beyond the fundamentals provided for a White Belt. Yellow Belts may have attended training sessions over a day or two, developing the knowledge they need be assigned to a project as fully contributing team members. They may guide limited-scope projects and assist managers at higher belt levels.

Green Belt
Earning a Green Belt certification requires professionals to attend a full course that introduces them to Six Sigma methods for developing and improving products, services and processes. They learn to apply problem-solving frameworks such as DMAIC: Define, Measure, Analyze, Improve and Control. This improvement cycle lays out a series of steps to understand the problems in a business process, set useful metrics for measuring changes, examine relevant data, implement solutions and then sustain the results over time.
Green Belt training is valuable for individuals in roles like project management, health care administration or financial management, giving them an understanding of performance metrics and tools like control charts and Failure Modes and Effects Analysis (FMEA). After certification, professionals are ready to take charge of projects, making the connections between LSS concepts and the goals of their organization. They can put leadership tools into action, find chances to eliminate waste and glean useful insights from data.

Black Belt
After completing their Green Belt courses, leaders may take their skills to next level by pursuing Black Belt certification. This advanced training requires previous knowledge of LSS strategies as professionals master the skills they need to plan, lead and explain more complex and expansive projects or organizational changes. Students in a Black Belt-level course acquire a rigorous understanding of how to drive organization-wide changes, analyze statistics, deploy Lean principles and supervise projects for a team of Green Belts.

During a Black Belt-level course, professionals demonstrate what they’ve learned and gain hands-on experience by conducting a project for their employer or a nonprofit organization. By setting down a project charter, collecting data and employing Six Sigma tools in a real-world context, students develop the abilities they need to make their businesses more productive and increase customer satisfaction.

Black Belts go on to execute LSS projects, monitor results and manage team dynamics. They run quality improvement and Lean efforts with the potential to make a significant impact on company-wide productivity.

Master Black Belt
A seasoned Black Belt with strong leadership and problem-solving skills can go on to become a Master Black Belt in LSS. This designation indicates that an expert takes a broad view of strategy throughout a business, coordinating teams across

Champion
A Champion is an upper-level manager who leads LSS strategy and deployment. Based on the objectives set by executive leadership, Champions ensure that all initiatives to lower waste and remove defects come together in alignment with a company’s needs for growth. Aided by Master Black Belts, these managers mentor the leaders involved in LSS implementation and track their progress.


Smith and Harry worked together to come up with a four-stage problem-solving approach: measure, analyze, improve, control (MAIC), which became a cornerstone for the Six Sigma process.

A typical process has been proven to have a shift in its average performance of up to +/- 1.5 sigma over the long term. A long term Six Sigma process that is rated at 4.5 sigma is considered to have a short term sigma score of 6 sigma. The difference between the Sigma Levels of a process over the short and long terms is called the Sigma Shift. Historically, people have assumed that the Sigma Shift is 1.5 and have therefore calculated long term capability by collecting only short term data, and subtracting 1.5 from the short term Sigma Level.

If, it's 230 defect in million then your company is at 5 Sigma level. Same goes for 4 Sigma as 6200 defect in million, 3 Sigma as 67,000 defect in million, 2 sigma as 310,000 defect in million & 1 Sigma as 700,000 defect in Million.